|
|||||||||||||||||||||||||||
SharePoint Business Intelligence
-
Microsoft SharePoint 2010 based Business Intelligence Solutions
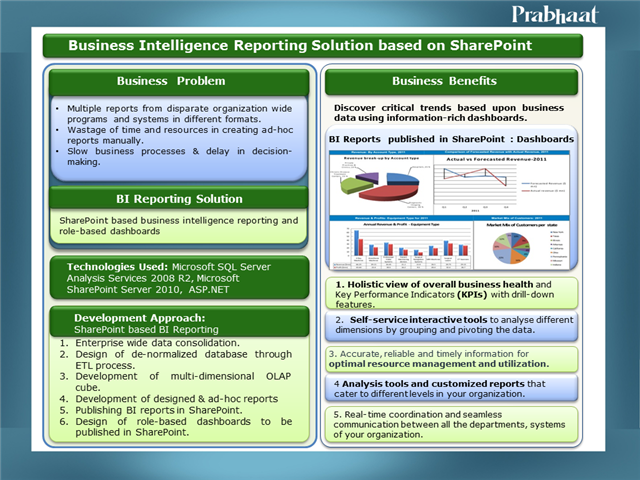
We have implemented SharePoint based BI project as a part of business intelligence solution we designed for our clients across healthcare, leasing, manufacturing, rail car leasing and real-estate industries. We combined and leveraged the power of the Microsoft® SQL Server® 2008 R2 Business Intelligence platform with the built-in business insight capabilities of Microsoft SharePoint® 2010—to consolidate data from all of their different systems into one fast and reliable reporting solution.
Sample Projects
1. Developed Business Intelligence Module with integration of designed and ad-hoc reports in Microsoft SharePoint for a client in leasing industry. Designed executive dashboards and scorecard view published in SharePoint which allowed decision-makers to access business insights through a common collaboration platform.
2. Integration of business intelligence reporting system with Microsoft SharePoint for a client in healthcare industry. Designed and implemented role-based employee and manager dashboards published in SharePoint which provided decision-makers a comprehensive view of business performance.
3. Developed Business Intelligence Module with integration of Microsoft SQL server based reporting system with Microsoft SharePoint which equipped users with reports and executive dashboards to have a snap-shot of over-all business operations for a client in manufacturing industry.
-
-
BI module & SharePoint based BI Reporting for a client in leasing industry
1. Development of Business Intelligence Solutions involved consolidation of data from organization wide systems in Central Database.

Central Database: Consolidation of organization wide data from following different systems:
1. Repair Module
2. Estimate Module
3. Invoicing Module
4. Mileage Module
5. Inventory Management Module
6. Asset Management Module
7. Switch Bill Module
8. Storage Module
9. Accounting System
10. CRM
2. A de-normalized data warehouse was developed from the Central Database (Client’s Database) using an Extraction Transformation Load (ETL) process.
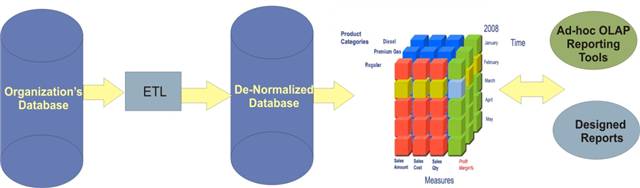
The multi-dimensional cube was constructed from de-normalized database.
Multi-dimensional Cube Dimensions and Measures
Business analysis team worked with process owners and users and carried out analysis of existing databases of client’s organization to identify cube dimensions and measures.
Dimensions:
a. Car
b. Customer
c. Time
d. Lease
e. OwnershipMeasures:
a. Loaded Miles
b. Empty Miles
c. Car Hire Amount
d. Switch Bill Amount
e. Base Rental Amount
f. Repair Labor Charge
g. Repair Material Charge
h. Asset Value
3. Design of tools to be used by Client: designed reports and ad-hoc reports that accessed the multi-dimensional cube to present the data.
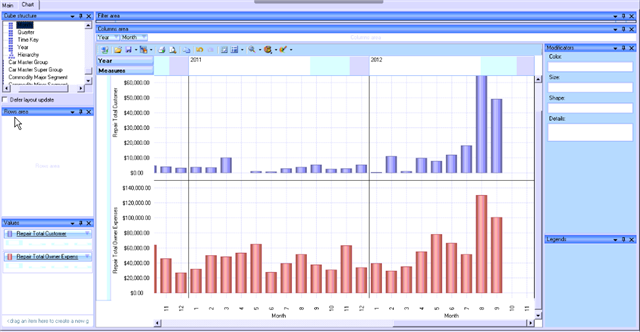
Custom Reporting: Ad-hoc Reports
With customized reporting, management team was able to drill down data to have meaningful insights into different divisions of business. They could view mileage data, repair data, expenses data across multi-dimensions such as car, customer, lease, ownership and time.For example, users could analyse total repair expense of owners, customers over the time period either month or quarter-wise across dimensions such as car-type, lease number, ownership data. It helped making better future leasing decisions depending on which particular railcar type involves more repair expense. It helps users discovering patterns in data to probe why particular railcar type or lease incurred high repair expense during particular time period or any trend associated with it.
4. SharePoint based BI Reporting: Executive Dashboard, Business Intelligence (BI)
It involved design and deployment of Executive Business Intelligence dashboards allowing users to make smart business decisions that impact bottom-line.
a. Executive BI dashboards to give snapshot of business performance in the form of KPIs and scoreboard view enabling decision-makers to access reports in ready to use format.
b. Customized solutions to enable decision-makers access business intelligence reports in real time in the desired format.SharePoint based Executive Dashboards provided a holistic view of overall business health and Key Performance Indicators (KPIs) while also allowing drill down into specific areas that may need further detailed analysis. Consolidation and normalization of data across disparate internal systems that resulted in consistent and accurate view of the business landscape allowed busy senior executives to gain deeper insight of the business at a macro level.
In this deployment scenario, leveraging the additional functionality captured during the project creation wizard, we implemented a SharePoint-based "executive dashboard" enabling executives (CXOs) to track railcar repair process at a high-level via a scorecard view (green light, yellow light, red light). The status and milestones of each railcar were evaluated in real-time and the event a major milestone slipped the dashboard would identify the risk immediately.
-